In today’s digital age, businesses are swimming in an ocean of data. Finding specific, useful information amidst this vast sea can often feel like searching for a needle in a haystack.
That’s where Trendata’s search function comes in. It’s like your personalised data guide, adeptly sifting through mountains of data to find exactly what you’re looking for.
It’s simple, powerful, and designed to address your specific questions that go beyond the scope of pre-made or default dashboards.
Let’s get started with the basics of searching in Trendata…
Types of data
The search bar in Trendata is designed to enhance your user experience by presenting a clear and organised view of your search phrases.
Each search phrase is enclosed within a box, providing you with a visual cue of where each phrase begins and ends. While you’re typing, your search phrases will appear as regular text. However, once you click out of the search bar, they’ll be boxed for easy identification.
The boxes are colour-coded based on the type of data they represent: measures are green, attributes are blue, and filters are grey.
Measures
Measures are numeric values that typically represent quantifiable data, like search volume or issue rate. In most cases, you’ll find measures plotted on the y-axis of your chart, providing a numerical basis for your data analysis.
Attributes
Attributes, on the other hand, are primarily text or date values. They usually represent categorical data such as product names, regions, or time periods. More often than not, attributes make up the x-axis of your chart, serving as the categorical basis against which measures are analyzed.
Filters
Filters play a crucial role in refining your data search. They help narrow down your search results to include only the data that aligns with your specific requirements. When you add a value to your search, it automatically becomes a filter.
How to conduct a search team in Trendata?
- Begin your data exploration journey by clicking on the search icon in the menu. This will redirect you to the search page, your launchpad for custom data queries.
- Craft your query by inputting the type of data you’re interested in
Press Enter or click on ‘Go’ to execute the search
Click on a result to view more detailed information. From here, you can add this data to your custom dashboard if desired.
Search example
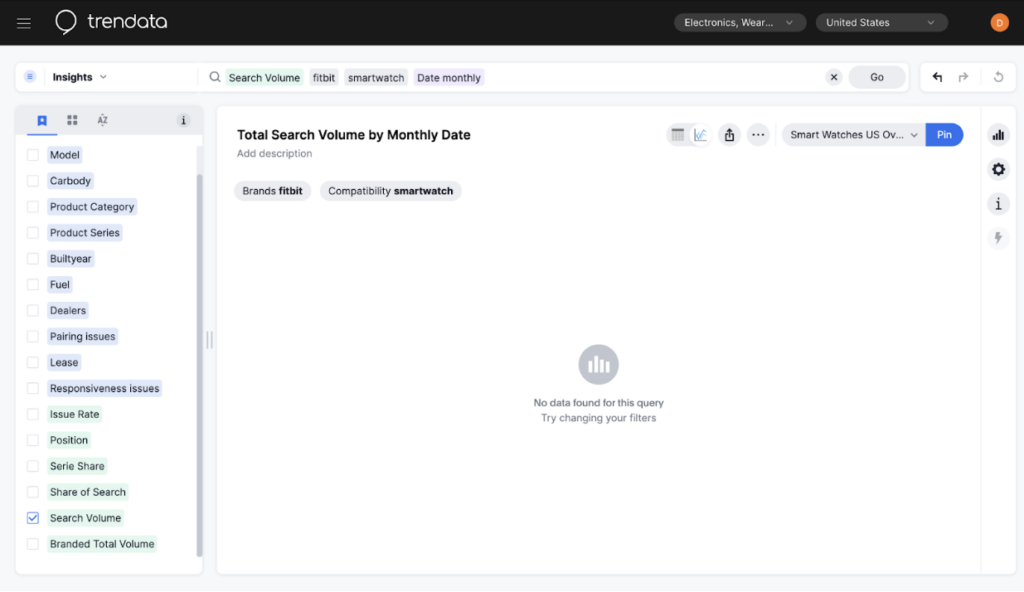
Let’s say you’re interested in comparing the monthly search volumes of ‘smartwatches’ and ‘Fitbit’. To visualise this data, simply type it in our search bar.Start with the measure you’re interested in, for instance, ‘Search volume’. Then choose an attribute — in this case, we’re comparing “smartwatches vs fitbit” To filter down your search even further, you break down the data month by month. Just type ‘Date monthly’ in the search bar.
Now you can see the comparative popularity of smartwatches and Fitbit on a month-to-month basis.
And if you want to change the chart format, simply click on the chart icon to explore various presentation options.
The search bar: Your gateway to data-driven decisions
Trendata’s search bar is more than just a search feature; it’s your gateway to uncovering new trends, making data-driven decisions, and tracking progress towards strategic objectives. By mastering this tool, you unlock a world of insights tailored to your specific business questions.
We hope this detailed guide has illuminated the power and potential of the search function within Trendata. If you’re still not convinced, take it a step further and learn how to get the most out of your search.