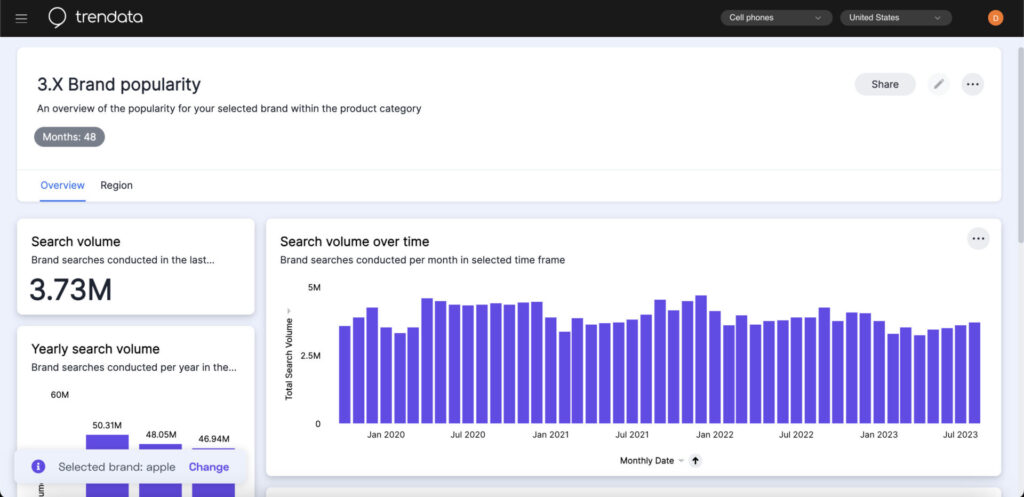
When it comes to collecting and analyzing data, one size definitely doesn’t fit all. That’s why Trendata has created a personalised dashboard that’s designed to put the power back in your hands.
Creating a personalised dashboard in Trendata isn’t just about customization, it’s about empowering you to build an information hub that’s tailor-made for your role and organization. It’s about providing you with the power to pinpoint and pull out the insights that matter most to you.
So don’t settle for a generic dashboard that only tells part of the story — let Trendata help you build a dashboard that truly works for you.
How to create your own dashboard
Creating your own dashboard in Trendata is a straightforward process.
Here’s a step-by-step guide:
- Begin from the Trendata homepage. Look for the hamburger menu icon located in the top left corner of your screen.
- Click on the hamburger menu, then choose the chart icon.
- You’ll see a plus sign next to ‘Custom’; click on it.
- You’ll be redirected to the search page.
- Use the search bar to create the specific insights you’re interested in.
- On the right side of your screen, click on the chart icon to shape the chart according to your preferences.
- Switch from a line chart to a column chart for a diverse visual representation.
- When you’re ready to save your chart, hit the pin button. You can choose to add it to an existing dashboard or create a new one.
- Confirm your choice by clicking on the blue checkmark.
Accessing your custom dashboard is just as easy — click on the hamburger menu, choose the chart icon, and there you’ll find your freshly minted dashboard under the ‘custom’ section.
The ultimate time savers
Time is a precious commodity. That’s where personalised dashboards come into play. By allowing you to create and save custom charts that focus on your specific areas of interest, our dashboards eliminate the need for sifting through irrelevant data.
With a personalised dashboard, you have immediate access to the insights that matter most to you. No more wasting time navigating through countless menus or conducting repetitive searches. Your data is organised, accessible, and presented in a way that aligns with your preferences.
So, by harnessing the power of customised dashboards in Trendata, you’re not just personalising your data analysis experience — you’re optimising your time.


